www.map.statistics.gov.lk

Local Authority Area Population Map

Responsive Image

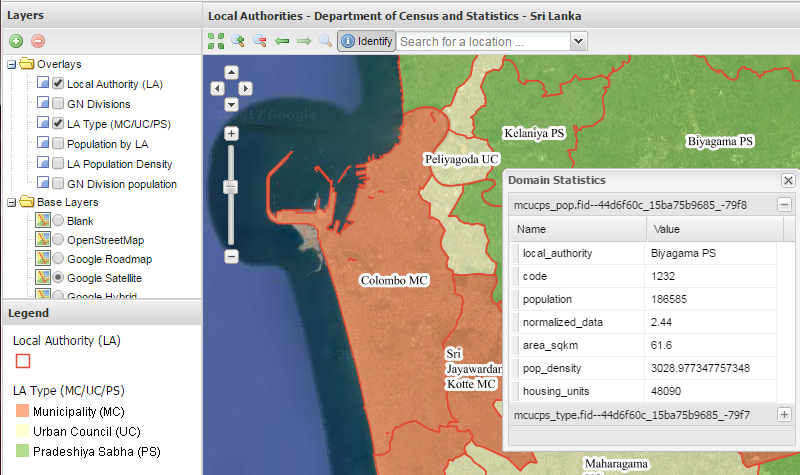
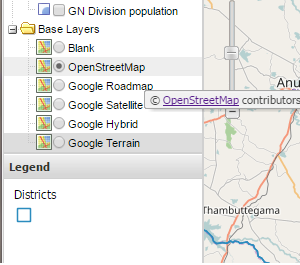
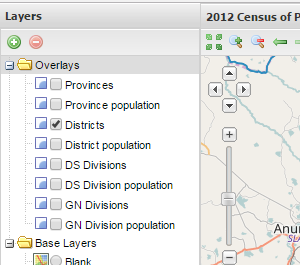
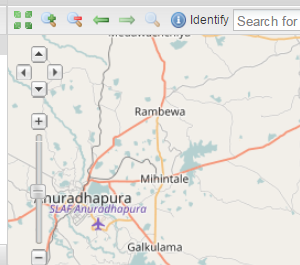
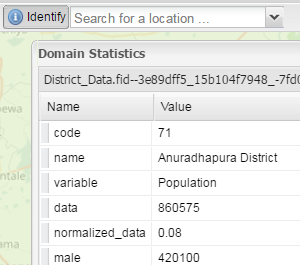
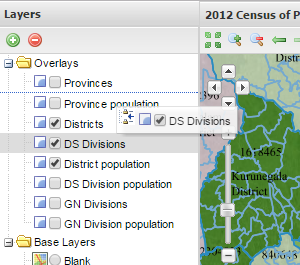
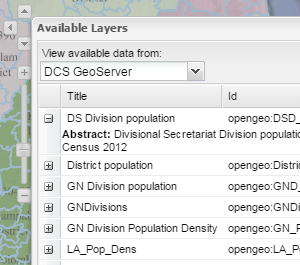
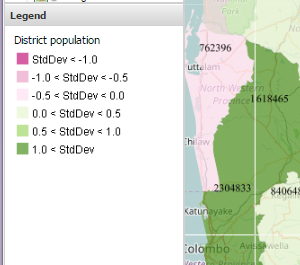
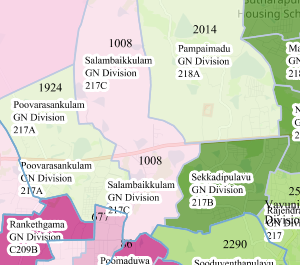
Local Authority population map is a map portal which can optionally display Local Authority and Grama Niladhari Division administrative area boundary layers as overlays and many other open layers available such as Google and Open road map layers as base layers. The list of available Overlays also includes thematic maps of Population, Population density etc. reported within the respective administrative boundaries during the Census of Population and Housing 2012.

User guide: How to ...

The following thumbnails explain and display how to get the things done within this map portal and answers to FAQs.

...

Display backgrounds

To display base layers from available open layers select the desired base layer by selecting the radio button located left to the desired layer. Please note that base layer loading time depends on the internet speed and only one layer at a time is allowed to be selected and displayed as the base layer. Selecting Blank as base layer results the overlays display on a blank screen without any back ground layer.

...

View it

...

Display overlays

Some overlays are already on display by default and the layers could be get on and off the display by selecting or deselecting the tick box located left to every layer. Multiple layers are allowed to display though the topmost layer according to the order of the list of layers covers the rest of the layers below it if it displays colors.

...

View it

...

Zoom and pan the map

Zooming the map could be done using either the vertical zoom slider, tool bar zoom buttons or using scroll up and scroll down of the mouse for zoom out and zoom in respectively. Additionally zooming to max, previous and next extents and to layer extent also possible using the 6 buttons provided at the left corner of the tool bar. When the mouse is used the center point for zooming would be where the mouse pointer is where as the vertical zoom slider and zoom buttons zooms in and out around the current center of the map.

For panning the map the 4 panning buttons located at the top left corner of the map or dragging the map to any direction with clicked mouse on the map could be used. The 4 panning buttons are useful when exact vertical or horizontal panning is needed.

View it

...

Find a place and Data

To find a place and data related to a certain area the Google search place holder has been placed at the end of the tool bar. Just type the name of the place to find in the search place holder and press enter key to find the place on the Google base layer map with automated panning the map where needed to center the place searched for in the map.

To read the data of a over lay the Identify button located at the tool bar should be kept pressed. When the mouse is clicked on the thematic map, the available data related to the place where clicked is read from the data table of the boundary (or polygon) or Data layer is displayed in a pop up table. To identify a boundary line and to get the names of the 2 areas of the map divided by the polygon line displayed in the pop up table the line or the border of the area should be clicked while the identify button is kept pressed.

View it

...

Change layer order

In order to avoid boundary layers being covered by the data layers the layer order could be changed and the desired view could be obtained. For example a lower level boundary could be brought up by dragging the layer in the layer list and dropping it above any layer or right at top or bottom of the list after moving up or down. Please note that the base layers are unique and can not be moved up or down.

View it

...

Add layers

Overlays are stored in DCS Geoserver from which different layers could be brought in to the list of overlays already set up as default layers. To bring new layers in to display use Add button located at top left hand side corner of the web page and select a layer from the DCS Geoserver layer pop up menu or any other server known by double clicking on any layer.

View it

...

Read the Legend

Thematic maps necessarily carry a legend to distinguish and illustrate prevailing differences between the macro data bounded to and collected at different administration areas. The Standard deviation of the data set, which could be calculated and applied for any data set is the best scale to group data in to a common list of categories. Data set transformed in to a standard normal distribution by distracting each data point value from the mean and then dividing it by the known and pre-calculated Standard deviation of the data set itself fits to a common legend as shown above. Mean value of the normalized dataset is always zero and above 1 and less than -1 values of a normalized data set could generally be considered as higher and lower extreme values respectively. Normalized data values lie between -0.5 and 0.5 are closed to the mean or average of the data while the data values ranging between -1 and -0.5 as well as 0.5 and 1 are neither extreme nor close to the average.

View it

...

Save and Print

The population and administration area map interactively displays a group of images and number of layers from which a unique portion is either copied or saved as user wished. When saving the map in to an image file the selected map tile of the topmost layer or the map component is downloaded and saves as an image in to user preferred storage location. The same portion can be copied and pasted on a text or image editor and this allows users to create their own page arrangement using different image components set at screen selecting a view from many different zoom levels and thousands of different views which panning the map brings in to display.

To print and/or save the map exactly as it appears on the screen the print screen option, which copies the screen image to the memory of the local web-browser machine could be used.

View it

Developed by Department of Census and Statistics - Sri Lanka
Copyright  2017 DCS, Sri Lanka, All Rights Reserved